.png "Jonathan DeVore")
Creating call flows can be intimidating. There are a lot of different ways to create call flows, not to mention all the different software out there to choose from.
Luckily, your company already has Microsoft 365 for business, which includes Microsoft Excel. In Excel, you can create basic flowcharts.
So, now that you have software that can do it, you can make a call flow diagram for your call center procedures. And, you just need to know how to start.
Working as a content coach for ScreenSteps — a knowledge base software company that helps call centers to create, store, and share their call flows — I’ve seen a variety of approaches to creating call flow diagrams as flowcharts.
While I obviously believe creating call flows in ScreenSteps is easier for both the author and the end-user, I see the benefit of using familiar software like Excel to document your call flows. Flowchart diagrams help you get the big picture figured out as you can visually see what you want reps to do.
That’s why I’ve created this quick six-step guide on how to create a call flow diagram in Microsoft Excel. As you follow these steps, you should have a complete call flow flowchart at the end of this article.
TIP: If you haven’t learned best practices for creating flowcharts or you would like to review how to make a flowchart, read this article before creating your call flow diagram in Excel.
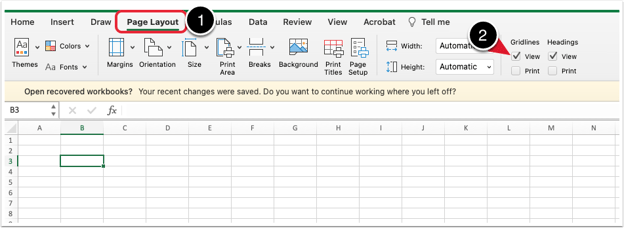
Step 1: Remove the gridlines
First, click “page layout” in the tabs at the top of the screen. Then uncheck “view” underneath “gridlines.”
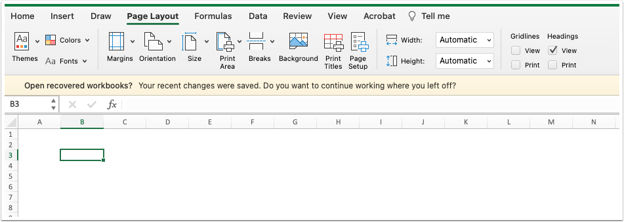
After you have removed the gridlines on Excel, your page should look like this.

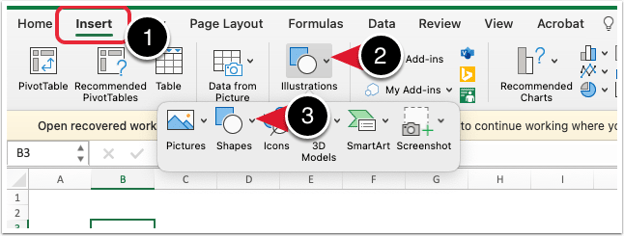
Step 2: Insert shapes
Adding shapes to your flowchart is a multi-step process.
A – Open shapes collection
To add shapes to your blank Excel sheet, click on the “Insert” tab at the top of the screen. Next, click “Illustrations” followed by “Shapes.”
B – Scroll to flowchart shapes
When you click on “Shapes,” a collection of symbols and shapes will appear. You want the “Flowchart” collection. Scroll down to view “Flowchart” shapes.
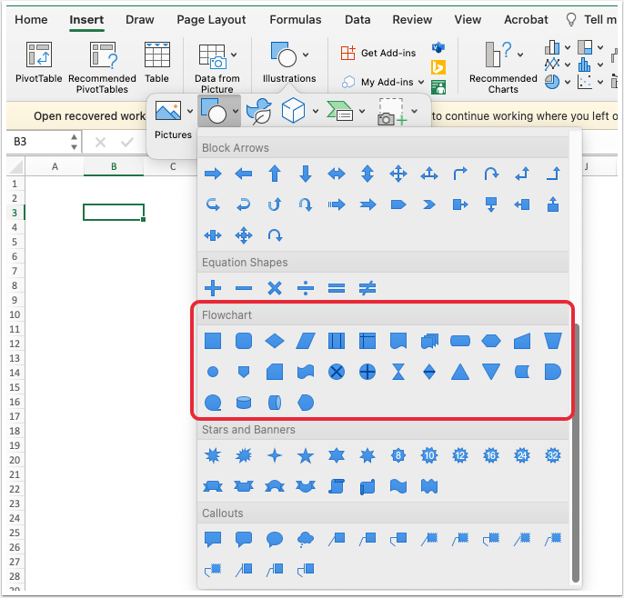
C – Select a shape
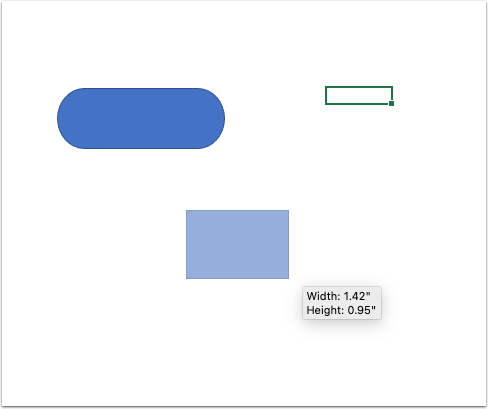
Choose a shape and click on it. Then drag your mouse to draw the shape. You’ll be able to adjust the shape to the size you want it.
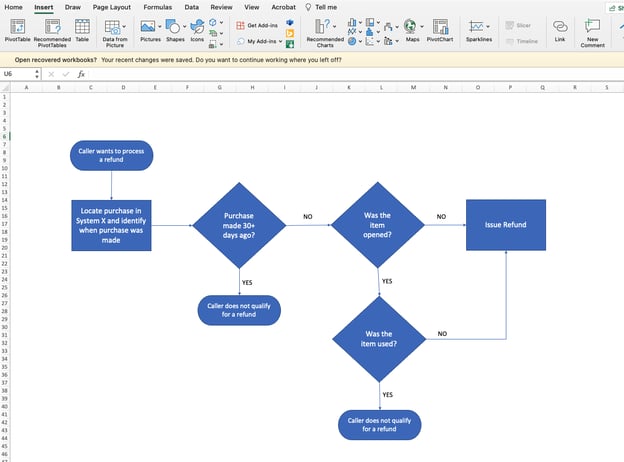
Continue to add shapes for each step of your call flow.
Important Note: With flowcharts, different shapes mean different things. It’s important to use specific shapes for specific actions. For example, diamond shapes typically indicate that a decision needs to be made and ovals mean the start/end of a procedure. See more shape tips here.
Step 3: Add arrows
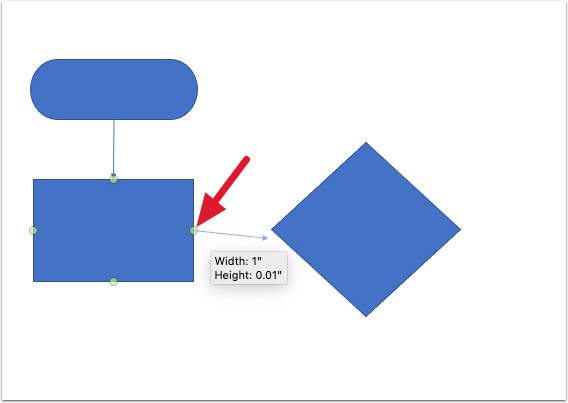
Connect the shapes (or steps) of your call flow procedure by adding arrows. The arrows direct the movement of the call. It visually leads the agent through the call flow.
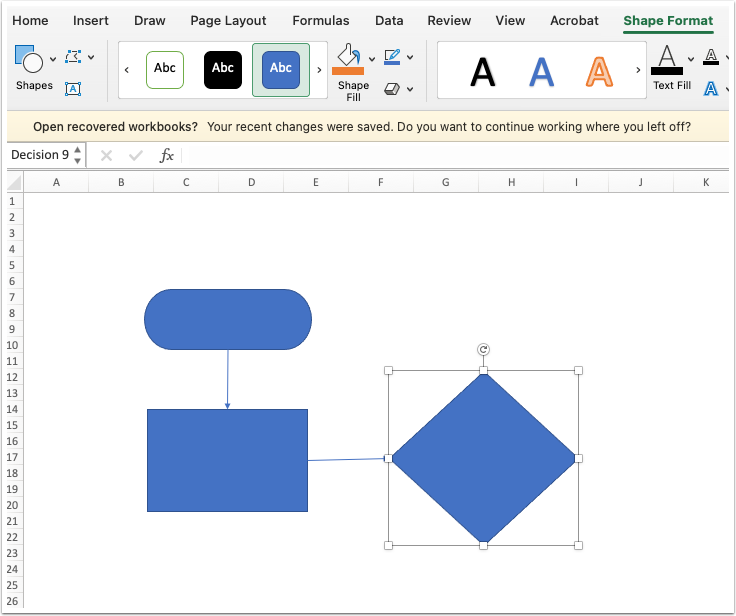
Because of the arrows in the above example, an agent would know to start at the oval shape, go to the rectangle next, and then move to the diamond.
TIP: You can connect the arrows to a shape so that if you move the shape, the arrow will stick to it.
Step 4: Build out a process map
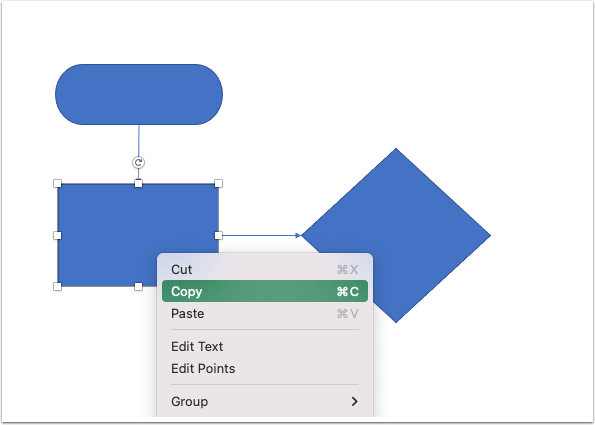
Tip: Once you get your three basic shapes in there, just copy and paste them to build out the process map. That way you don’t have to keep going back and forth to get the same shapes over and over again.
Step 5: Add text to your decision tree
Add text into each shape. You’ll add text by clicking “Text” at the top of the screen and adding a text box to each shape.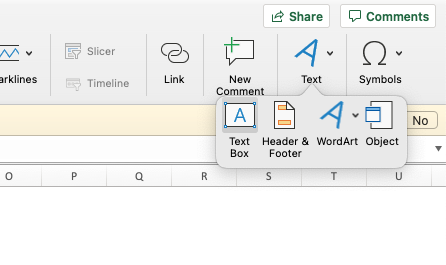
6. Build out your flowchart
Now that you have the basic shapes and structure to your flowchart, you can build out your flow. Add shapes, connect steps in your decision tree, etc.
How to write call flows (outside of Excel flowcharts)
Using Excel to create call center flowcharts is probably a convenient option for your company. And, if your agents are able to use those without making mistakes on a call, then that is working for your company. There is no need to change.
However, if your agents are making mistakes on calls because they can’t follow your call flow diagrams, it may be time to look at other options.
There is more than one way to create a call flow for your call center. You can:
- Create flowcharts (like in this Excel example)
- Write them in Word or another text document (standard articles)
- Build interactive call flows using cloud-based software (workflow articles)
ScreenSteps is a knowledge base software that allows you to quickly create call flows as standard articles and workflow articles. The simple yet powerful authoring tools help you quickly create call flows that are easy for your call center agents to follow while they are on a call.
Explore your call flow documentation options with this article on how to write your call flows. This will help you decide what is the most efficient way for you to write call flows that will best support your call center agents.